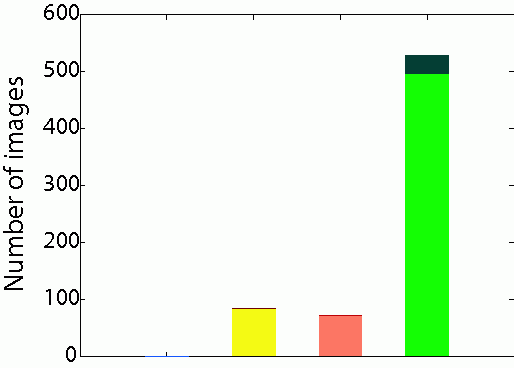

The blue bar is the number of images in the LabelMe dataset, the yellow bar is the number of images in Caltech 101 clean dataset collected manually from the Caltech101 raw dataset. Red bar represents the number of collected clean images (P) by OPTIMOL from Caltech101 raw dataset with the dark red part at the top of the red bar representing the number of False Positives (F). Green bar shows the number of clean images collected by OPTIMOL from our own downloaded images using the category name as the query word plus the Caltech101 raw dataset. The dark green part at the top is the number of False Positives.


