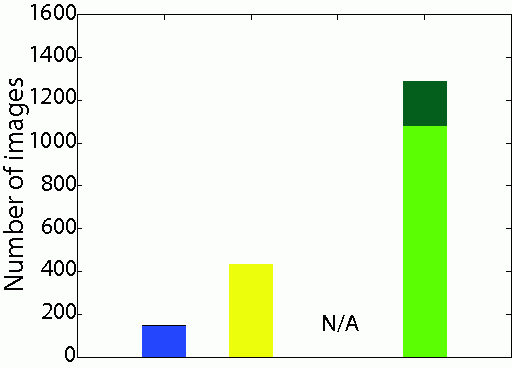

The blue bar is the number of images in the LabelMe dataset, the yellow bar is the number of images in Caltech 101 clean dataset collected manually from the Caltech101 raw dataset. Red bar represents the number of collected clean images (P) by OPTIMOL from Caltech101 raw dataset with the dark red part at the top of the red bar representing the number of False Positives (F). Green bar shows the number of clean images collected by OPTIMOL from our own downloaded images using the category name as the query word. The dark green part at the top is the number of False Positives.
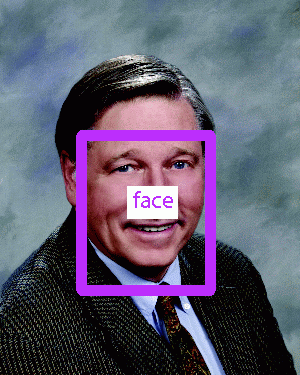
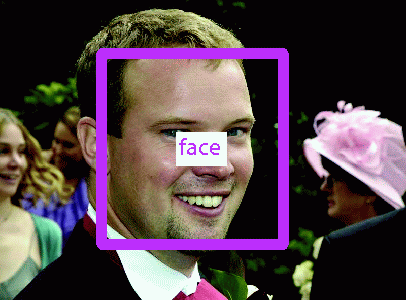
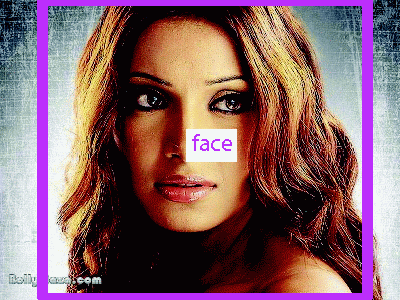
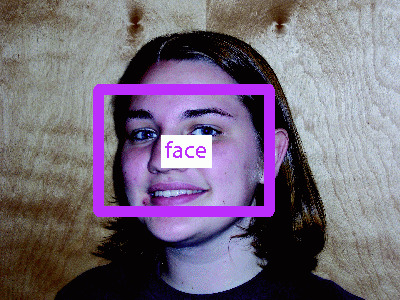
Since the pictures in the ˇ°faceˇ± category of Caltech 101 are taken by camera instead of downloading from the web, the raw images of the ˇ°faceˇ± category in Caltech 101 are not available. Hence, we add ˇ°N/Aˇ± to the third bar in the figure, which represents the number of retrieved images by OPTIMOL from the ˇ°faceˇ± category in Caltech 101.
